Associating environmental metadata with microbial genomes retrieved from metagenomes is a notoriously hard problem. Metadata for the source sample(s) is often limited, and can be hard to retrieve at scale. We circumvented this problem by using the detection of GlobDB genomes in the 700k+ metagenomes present in the Sandpiper database, created using SingleM by Ben Woodcroft and colleagues.
Building on Sandpiper, we have developed MetaCoOc (work led by talented postdoc Ben Coltman), a tool that predicts environmental association and/or co-occurrence of microorganisms from metagenome data. MetaCoOc leverages presence/absence of taxa in metagenomic datasets included in Sandpiper to assess whether a taxon is associated with an environment, or another taxon.
During the work on MetaCoOc, we realised that we could generalise the environmental association to broad environmental classification for all GlobDB genomes. To do so, we used the available metadata to classify all metagenomes in a two-level nested environmental classification scheme. The top level consists of 6 categories (animal_associated, aquatic, built, other, sediment, soil, and unassigned), and the second level refines this with 34 subcategories.
With all metagenomes classified, we then summed the presence of each GlobDB genome across datasets of each category. We provide files for both the number of datasets of each category, and the percentage of datasets of each category, that each genome is detected in as separate files on the Downloads page.
In addition, the environmental metadata is included in the amino acid sequence toolkit (AASTK) SQL database, and can be used to decorate plots generated using AASTK, or can be directly accessed using the Meta command. This way, any dataset of GlobDB derived amino acid sequences can be directly annotated with their primary environments.
There are many applications for this environmental metadata. One example is shown below, where I have decorated a concatenated marker gene phylogeny of ammonia oxidizing Archaea (AOA) with stacked bar charts indicating the percentage of each top level environmental category a genome is detected in. The gaps indicate genomes that were not detected in the metagenomes in sandpiper using singleM. This image is generated using iToL.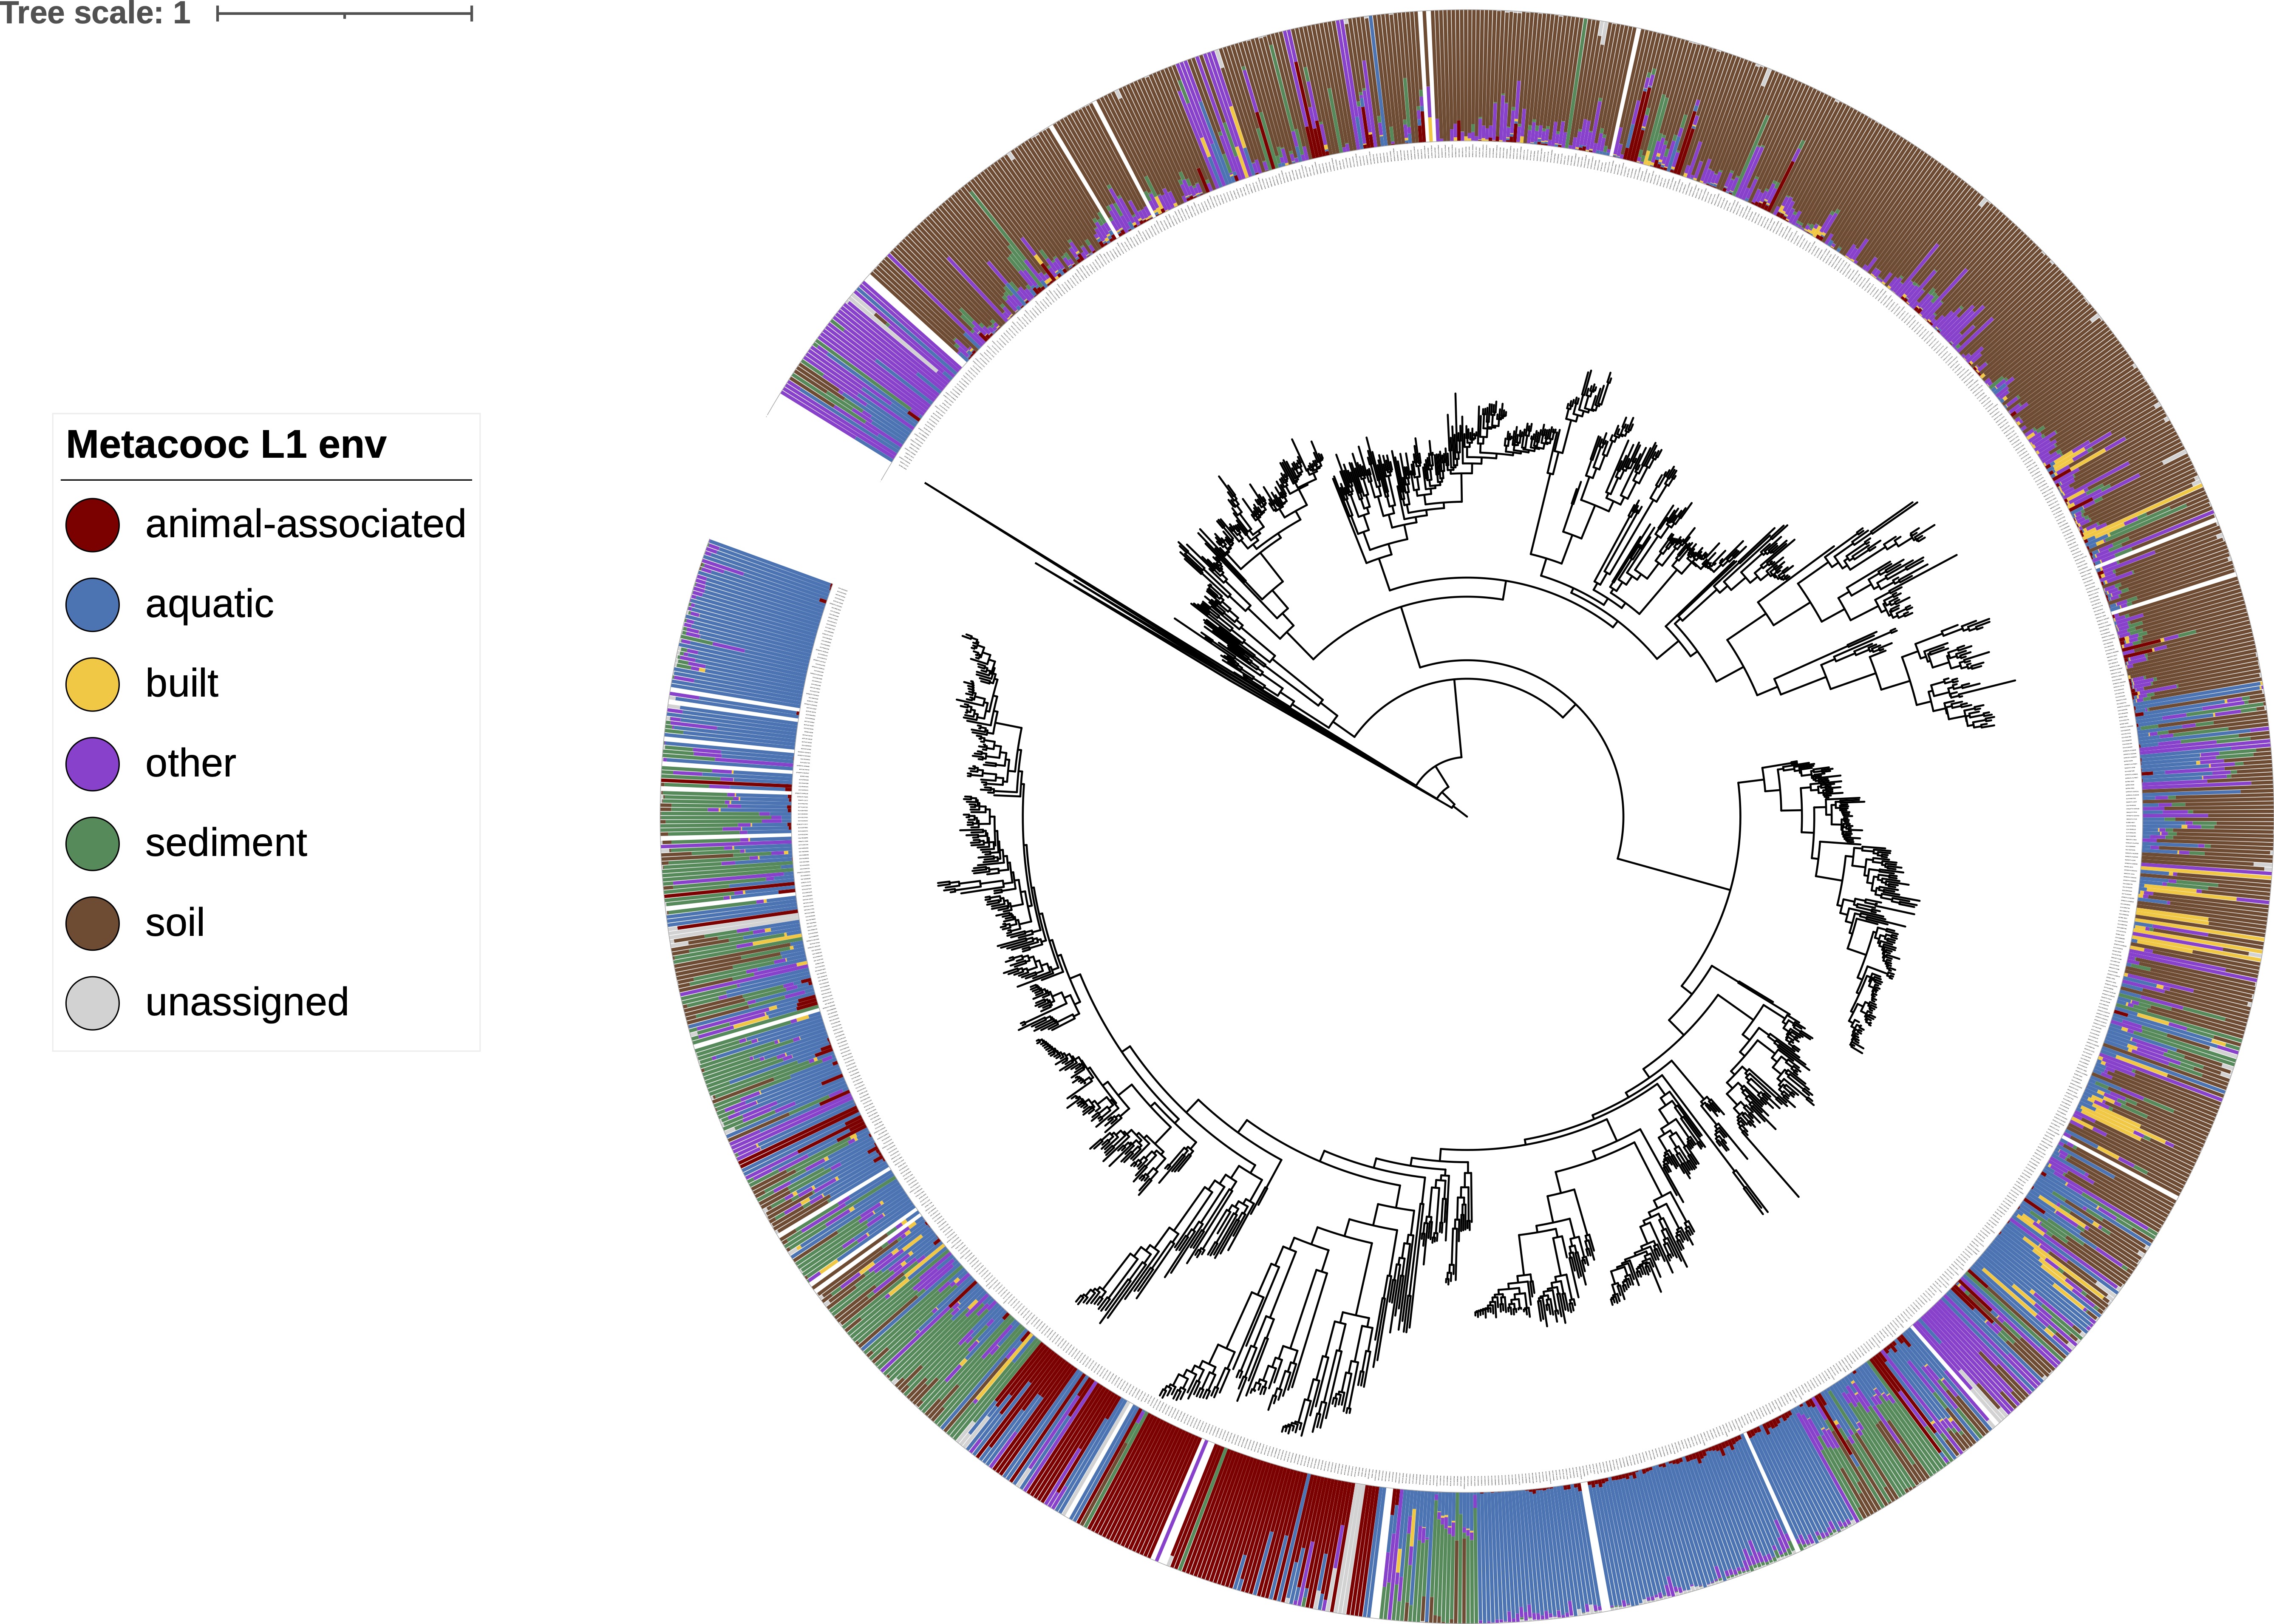
Comments